Ctrl+K

Norkyst documentation

  • Norkyst model documentation
  • User guide
  • Gallery
  • Norkyst model documentation
  • User guide
  • Gallery

Section Navigation

  • Timeseries
  • Read variables from a model along the trajectories of drifters.
  • Plot current maps
  • Plot T-S diagram
  • Plot cross-section
  • Calculate and plot Turner Angle
  • Gallery

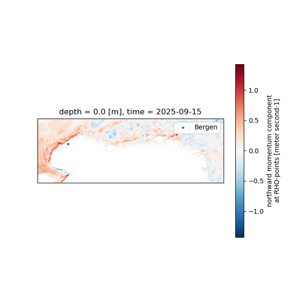
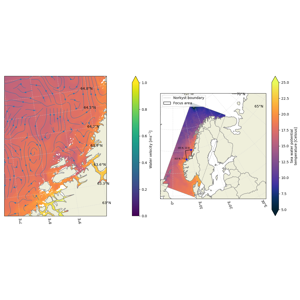
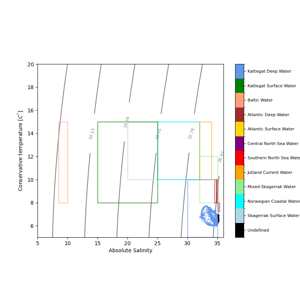
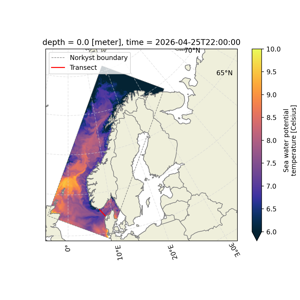
Gallery#

Timeseries

Timeseries

Read variables from a model along the trajectories of drifters.

Read variables from a model along the trajectories of drifters.

Plot current maps

Plot current maps

Plot T-S diagram

Plot T-S diagram

Plot cross-section

Plot cross-section

Calculate and plot Turner Angle

Calculate and plot Turner Angle

Download all examples in Python source code: gallery_python.zip

Download all examples in Jupyter notebooks: gallery_jupyter.zip

Gallery generated by Sphinx-Gallery

previous

Quickstart: read and plot data

next

Timeseries

Edit on GitHub
Show Source

© Copyright 2025 Norwegian Meteorological Institute.

Created using Sphinx 8.1.0.

Built with the PyData Sphinx Theme 0.18.0.